Three Approaches to “Back Of The Envelope” Forecast Models and Beyond
In 2001, Dean Kamen and his team introduced the world to the Segway: a self-balancing, stand-up scooter that, they posited, would revolutionize transportation. Kamen and his investors thought they would have no problem selling 10,000 units per week within a year. Fast-forward 21 months, however, and Segway had only sold 6,000 units – not exactly a paradigm-shattering market entry.

How did the team get it so wrong? Rather than examining the strategic entry challenges the company faced (competing with entrenched incumbents, legislators not knowing how to handle the new device, etc.), I want to look at their forecasting. Why were they off by 99%, and, more importantly, how can those of us who forecast markets regularly avoid their mistakes?
Without knowing Mr. Kamen or his investors, it is tough to say exactly how they arrived at their 10,000 units per week figure. What we can do, however, is review a few key methods that improve the accuracy of models and examine how to implement them in our own organizations:
1. Test assumptions with a reverse income statement
In their book Discovery-Driven Growth, Rita McGrath and Ian MacMillan propose the concept of a “reverse income statement” as a means of rapidly determining the baseline viability of a business plan. Here’s the basic premise: you start with a number – ‘what must we make for this project to be a success’ – and work backwards from there to get to the associated costs and margins to see if they are reasonable. It’s a quick, simple, back-of-the-envelope calculation, but it can be incredibly powerful.
In addition to testing key assumptions, reverse income statements also force you to define your objectives very early on – in order to work backwards, you need to know where you want to end up. Without this emphasis on project outcomes, companies can fall into a ‘sliding vs. deciding’ situation where product development and launch become inextricably linked to the whims of the market. When instead you decide exactly what your objectives for an initiative are before you even get started, you can crystallize your focus and identify ways of developing real traction towards accomplishing it.
2. Take a critical look at what portion of your addressable market is actually available
Once you have defined your bottom line objectives and confirmed that the operational steps needed to get there are feasible, the next step is to challenge the top line – revenue. Underpinning every product development forecast are two key factors: addressable and available market. Sometimes referred to as total addressable market and serviceable available market, they refer to the broadest possible market your product could address and the portion of the market your product is most likely to actually reach, respectively. How you go about defining these segments is critical to a robust understanding of an opportunity.
At Newry, we have worked on countless projects for clients who have identified a target addressable market of millions or billions of dollars, only to realize later that the market is divvied up into highly focused sub-segments, not all of which may be addressable by a single product. While this sort of finding does not necessarily mean that the product is dead in the water (it is still plausible that adjacent markets may be promising), it is crucially important to establish realistic distinctions between “addressable” and “available” in order to build out an accurate forecast.

Many enormous-seeming opportunities are actually made up of fragmented sub-segments that cannot be addressed with just one product
Sadly, there is no ‘secret sauce’ or shortcut here. In most cases, getting a good market segmentation means picking up the phone or putting boots on the ground to go talk with potential customers. Starting a dialogue with those most familiar with the market you are trying to serve will give you invaluable insights and a nuanced understanding that isn’t available in cookie-cutter market reports or via secondary research.
3. Do not shy away from statistics
For those of us who love math and modeling, this last step is a given. Unfortunately, not everyone has the skill or inclination to do this quantitative footwork – with undesirable consequence of less comprehensive and defensible forecasts. While the following methods are admittedly more advanced, they’re worth taking the time to understand:
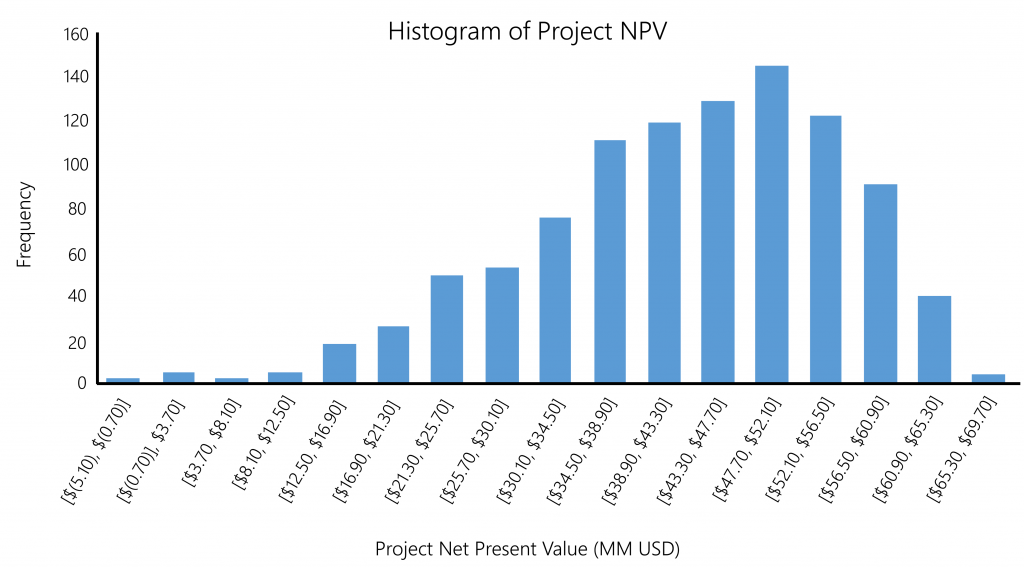
- Monte Carlo Simulations: Used to account for some of the variability associated with incomplete information, e.g., future market penetration, interest rates, etc., this approach uses random numbers to create varied outcomes across a given distribution and then runs hundreds or thousands of simulations for the sole purpose of introducing variability. While it may seem counterintuitive, it is one of the best ways of accounting for unforeseen variables in otherwise deterministic processes.

Running a Monte Carlo analysis across 1000 different product launch scenarios shows the frequency distribution of potential project NPVs
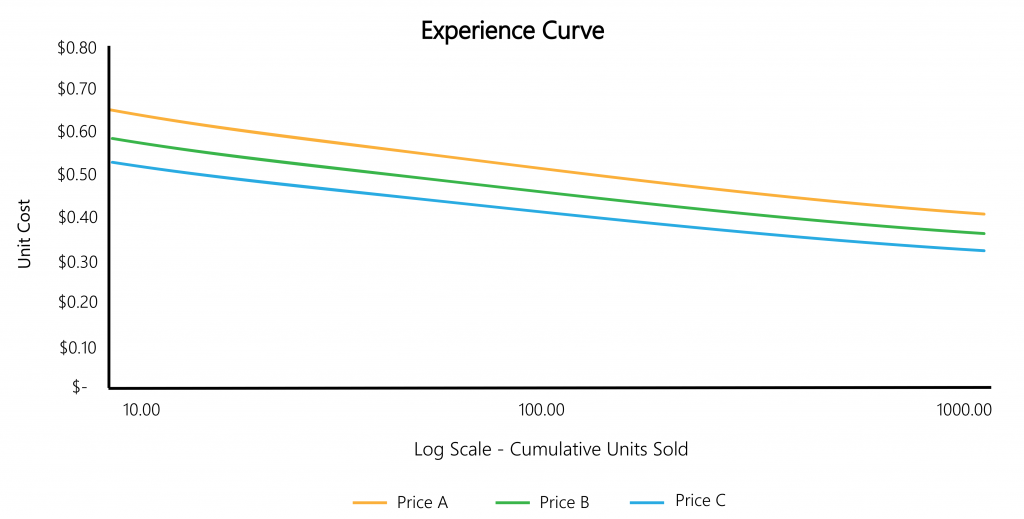
- Experience Curves: Popularized by BCG in the late 60’s, experience curves develop the relationship between sales volumes and cost to manufacture. In this relationship, costs decrease linearly as volumes increase logarithmically. However, the rate at which costs decrease is highly dependent on the industry and type of product. Determining this factor is where a hefty amount of business acumen and experience come in handy.

Here, as cumulative units sold increases logarithmically, the unit cost for products A, B, and C decreases linearly
- Bass Diffusion Models: While there have been many variations and extensions to Frank Bass’ original formula (also published in the late 60’s), even understanding the base model is an important step away from the ‘standard’ straight-line diffusion so often assumed in forecasts. Most often the Bass Model looks like the familiar S-curve (generically called a sigmoid function), though adjusting parameters impacts the rate of early and late adoption.
Most forecasts will never be perfect. Despite our best efforts, unforeseeable events sometimes irrevocably alter the path we thought would play out. Still, putting in the work up front to test assumptions and build out robust models can pay dividends by giving you the confidence needed to either kill the project or move forward with conviction.
Find out how Newry can help your organization decide where to focus. Have conviction and validation about the opportunities you’re pursuing.

